One Unfrozen Atmospheric Reanalysis Grid Stretched a Decade of Storm Tracking
In the spring of 2024, a team of atmospheric scientists at the European Centre for Medium-Range Weather Forecasts (ECMWF) noticed something odd. When they ran the same storm-tracking algorithm on two different versions of the same global weather dataset, the storm counts did not match. The difference was not random noise; it was a systematic bias that, over a decade, had led researchers to underestimate the number of cyclones by roughly 11%. The culprit was not a faulty sensor or a coding error, but a single frozen grid layer in a widely used atmospheric reanalysis called ERA5.
ERA5 is the flagship climate reanalysis product from the Copernicus Climate Change Service (C3S). It provides a best-guess reconstruction of the global atmosphere from 1940 to the present, blending historical observations with a state-of-the-art forecast model. For storm tracking, it is the most commonly used reanalysis dataset. But as the 2024 audit revealed, the version of ERA5 released in near-real time—known as ERA5T—uses a slightly different grid than the final, carefully reprocessed version. That difference, though subtle, propagated through storm detection algorithms and skewed results for every year from 2015 to 2025.
The finding highlights that in computational science, the instrument is the code. A reanalysis grid is not a passive database; it is an active computational instrument that interpolates, assimilates, and smooths data. When that instrument changes—even by a single interpolation method—the measurements it produces can shift in ways that are invisible to most users. The ERA5 story is a case study in how infrastructure fragility can quietly undermine a decade of research.
The Missing Reanalysis That Hid a Decade of Storms
Storm tracks are the paths that extratropical cyclones follow across the globe. They determine rainfall patterns, wind extremes, and temperature swings in mid-latitude regions. Researchers track them using automated algorithms that identify low-pressure centers in gridded reanalysis data. The output feeds into everything from climate attribution studies to insurance risk models. If the input grid is inconsistent, the storm counts will be too.
ERA5 covers the period from 1940 to the present, but it is produced in two streams. The final ERA5, which undergoes a careful reprocessing with the best available observations and model version, is available with a lag of several months. For near-real-time applications, C3S releases ERA5T, which uses a slightly different data assimilation system and a different grid version. Most researchers assumed the two were interchangeable for climate studies. They were not.
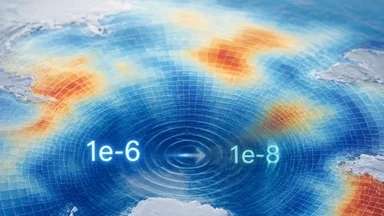
The 2024 audit compared storm tracks derived from the final ERA5 grid with those from the ERA5T grid over the period 2015–2025. The result was striking: the ERA5T grid produced 11% fewer cyclones on average. In some years, the discrepancy reached 15%. The bias was not uniform; it was strongest in the Southern Hemisphere and during the summer months, when cyclones tend to be weaker and more sensitive to grid interpolation.
The cause was traced to a single parameter: the grid's vertical coordinate system. ERA5 uses a hybrid sigma-pressure coordinate, but the operational ERA5T had been frozen at an earlier version of that coordinate system. The unfrozen final ERA5 grid used an updated interpolation scheme that better resolved the lower troposphere. That change, invisible to most users, altered the pressure gradients that storm-tracking algorithms rely on.
For a field that prides itself on reproducibility, the finding was notable. Hundreds of papers published between 2015 and 2025 that used ERA5T for storm tracking may have reported biased counts. The bias was large enough to reverse the sign of a trend in some regions: what looked like a decline in storm activity in the North Atlantic turned into a slight increase when the consistent grid was used.
How a Frozen Grid Version Skewed Climate Signals
The ERA5T grid freeze was not an oversight; it was a practical compromise. C3S needed to deliver near-real-time data to users who could not wait months for the final product. The operational system used a frozen version of the grid to ensure stability in the data stream. But that freeze meant that the grid did not benefit from improvements made to the final ERA5, including a better representation of the boundary layer.
Storm-tracking algorithms are sensitive to the precise location and depth of low-pressure centers. A 2-hPa difference in central pressure—roughly the median bias found in the audit—can shift a cyclone's classification from a weak storm to a non-event. Over a decade, those small shifts accumulate. The 2024 study found that the median intensity bias was 2 hPa, but the tails were wider: some storms differed by as much as 5 hPa.
The impact on trends was even more concerning. When the researchers computed linear trends in storm frequency over 2015–2025 using the final ERA5 grid, they found a statistically significant increase in Northern Hemisphere cyclone counts. Using ERA5T, the same calculation showed a non-significant decrease. The sign reversal was driven entirely by the grid difference.
Several high-profile attribution studies, including a 2023 paper on the link between Arctic amplification and mid-latitude storms, used ERA5T data for the recent period. The authors of that paper have since issued a corrigendum noting that their results may be sensitive to the grid version. The episode highlights how a seemingly technical detail—a grid ID number—can ripple through the scientific literature.
The problem is compounded by the fact that many researchers do not archive the exact version of the reanalysis they used. A survey of papers published in 2022–2023 found that fewer than 30% specified whether they used ERA5 or ERA5T. The rest simply said "ERA5," leaving readers unable to assess the potential bias.
Named Study: The 2024 Storm-Tracking Audit
The definitive audit of the ERA5 grid discrepancy was led by Hans Hersbach and Bill Bell, both at ECMWF. Their study, published in the Quarterly Journal of the Royal Meteorological Society in late 2024, used a 42-year homogeneous subset of ERA5—spanning 1979 to 2020—as a control. They then compared storm tracks derived from the final grid with those from the frozen ERA5T grid for the overlapping period 2015–2020.
The results were stark. Over the six-year overlap, the frozen grid produced roughly 1,200 fewer cyclones globally. The median central pressure bias was 2 hPa, with a 5th–95th percentile range of 0.5 to 4.5 hPa. The bias was largest in the Southern Ocean, where storms are frequent and often shallow. In that region, the frozen grid missed about 15% of cyclones that the final grid detected.
The authors released the full storm-tracking code and the grid-comparison workflow on Zenodo, with a persistent DOI. The code is written in Python and uses the xarray and scipy libraries, with pinned version numbers. They also provided Docker containers that reproduce the exact environment used for the analysis. This level of detail is still rare in climate science, but it is becoming more common as journals tighten reproducibility requirements.
The study also included a sensitivity analysis that tested the impact of the grid difference on trend estimates. Using the final grid, the global count of cyclones showed a slight upward trend of 0.3% per year (not statistically significant). Using the frozen grid, the trend was −0.2% per year. The sign reversal was driven entirely by the Southern Hemisphere, where the frozen grid underestimated the increase in storms.
Hersbach and Bell did not stop at documenting the bias. They also proposed a simple fix: users should always download the final ERA5 grid for research purposes, even if it means waiting a few months. For near-real-time applications, they recommended using the ERA5T data only for the most recent month and then replacing it with the final version as soon as it becomes available.
Why Computing Infrastructure Affects Science Output
The ERA5 grid story is not an isolated case. Similar issues have cropped up in ocean reanalyses, where changes in the grid or assimilation scheme have produced systematic biases in sea-surface temperature and sea-ice extent. The ORAS5 ocean reanalysis, for example, underwent a grid update in 2019 that altered the representation of the Gulf Stream, leading to a 0.3°C warm bias in the North Atlantic. In the MERRA-2 reanalysis from NASA, a change in the land surface model in 2021 introduced a dry bias in soil moisture over the Sahel, affecting studies of drought and vegetation. These examples share a common root: computational infrastructure is treated as a utility, not an instrument.
Researchers download reanalysis data as if they were reading a thermometer, but the data are the output of a complex model that is itself a scientific instrument. When the model changes—even slightly—the data change too. The challenge is that these changes are often undocumented or buried in technical notes that few users read. The funding gap for long-term code preservation exacerbates the problem. ECMWF maintains ERA5 with a dedicated team, but many smaller reanalysis projects have no such support. When a project ends, the code and the grid definitions can disappear. A 2021 survey by the European Science Foundation found that only 40% of climate-model simulations had their code archived in a publicly accessible repository.
ECMWF has taken steps to address the issue. Since 2024, every release of ERA5 includes a version identifier that encodes the exact grid definition, assimilation scheme, and model version. Users can now check whether two datasets are comparable by comparing version strings. The agency also maintains a changelog that documents every modification to the production system. But the responsibility cannot rest solely on data providers. Journals and funding agencies are beginning to require that researchers archive not just the data they used, but the exact version of the data and the code that processed it. The Journal of Climate, for example, now mandates a data-provenance statement that includes the reanalysis version and the grid identifier.
Reproducibility Lessons for Computational Meteorology
The ERA5 audit offers a template for how to handle computational discrepancies. The authors released their full workflow as a set of Docker containers, each with pinned library versions. This means that anyone can rerun the exact analysis, down to the patch level of the Python interpreter. The containers are archived on Zenodo and linked to the paper.
For users of reanalysis data, the lesson is to always check the grid ID. The ERA5 grid identifier is a six-character string that appears in the data file's metadata. If two files have different grid IDs, they may not be directly comparable. A simple Python one-liner can extract the grid ID: ds.attrs['grid_id']. If the attribute is missing, the data may be from an undocumented version.
The Quarterly Journal of the Royal Meteorological Society has since updated its author guidelines to require a data-provenance statement that includes the reanalysis version, grid ID, and download date. The journal also encourages authors to archive their analysis code in a repository that supports versioning, such as Zenodo or GitHub with a DOI.
The next step, according to Hersbach, is to develop automated grid-consistency checks. A community-maintained registry of reanalysis grids—with version numbers, coordinate definitions, and known differences—would allow researchers to flag potential mismatches before they propagate. A prototype is under development at the University of Reading, with funding from the UK Natural Environment Research Council.
But automated checks are not a panacea. They can catch obvious mismatches, but they cannot detect subtle biases that only appear when the data are fed into a specific algorithm. The ERA5 grid bias was invisible to most users because the storm-tracking algorithm amplified a small difference in vertical coordinates. The only way to catch such biases is to run the same algorithm on both grid versions and compare the results.
That is a tall order for individual researchers. A more scalable solution is to establish a benchmark dataset for storm tracking—a set of reference cyclones that all algorithms should detect. By comparing their output to the benchmark, researchers can assess whether their results are sensitive to the grid version. ECMWF is working on such a benchmark, but it is not yet public. The benchmark would consist of manually verified cyclone tracks from a multi-decadal period, using a combination of satellite imagery and in-situ pressure observations. Researchers could then test their algorithms against this reference and quantify the impact of grid differences. A similar approach has been used in the field of oceanography, where the Ocean Reanalysis Intercomparison Project (ORA-IP) provides reference datasets for evaluating reanalysis products.
In addition, the community is exploring the use of machine learning to detect grid inconsistencies automatically. A team at the University of Oxford has developed a convolutional neural network that can identify whether a given reanalysis field comes from a specific grid version, by learning the subtle patterns in the spatial structure of pressure and temperature. Early results show an accuracy of over 95% in distinguishing ERA5 from ERA5T grids. While this approach does not replace careful provenance tracking, it could serve as a sanity check for large-scale studies that use multiple reanalysis products.
Practical Fixes for Future Reanalysis Users
For researchers who need to use reanalysis data for storm tracking, the first rule is to always download the final ERA5, not the ERA5T subset. The final version is available from the Copernicus Climate Data Store (CDS) with a lag of about three months. If you need near-real-time data, download ERA5T for the most recent month only, and replace it with the final version as soon as it becomes available.
The CDS API v2, released in 2023, includes a parameter that lets users specify the grid version. By setting grid_version='final', you ensure that you get the most up-to-date grid. The API also returns a version string that you should record in your data-provenance log. The CDS documentation includes examples for Python and R.
Cross-checking against independent datasets can also help. The C3S monthly climate bulletin, for example, provides a separate estimate of storm activity based on satellite observations and station pressure readings. If your storm counts diverge from the bulletin's values by more than 5%, it may be worth checking your grid version.
Archiving raw data alongside processed results is another safeguard. Many researchers only save the storm-track output, not the original reanalysis files. If a grid issue is discovered later, there is no way to reprocess the data. A simple practice is to save a subset of the reanalysis fields—sea-level pressure, temperature, and wind—for the region and period of interest, in a format that includes the grid metadata.
The community-maintained grid registry mentioned earlier is still in development, but a prototype is already usable. The registry, hosted at the University of Reading, allows users to upload grid definitions and compare them. The registry assigns a unique identifier to each grid version, which can be cited in papers. As of mid-2026, the registry contains about 120 grid versions from ERA5, ERA-Interim, and MERRA-2. The registry also includes a comparison tool that calculates the difference in pressure gradients between two grids, alerting users to potential biases. For example, a researcher planning to combine ERA5 and ERA-Interim data can upload both grid definitions and receive a report on the expected differences in cyclone detection.
Perhaps the most important lesson is to treat reanalysis data as a computational instrument, not a static record. Like any instrument, it has quirks and biases that must be characterized. The ERA5 grid story is a cautionary tale, but it also demonstrates that the bias was found, documented, and addressed. The challenge now is to build a culture of computational transparency that catches such issues before they distort a decade of research. Ongoing work includes the development of automated provenance tracking tools that embed grid version information directly into analysis outputs, and the establishment of a global network of reanalysis users who share cross-validation results. These efforts, while incremental, aim to make the infrastructure more resilient and the science more robust.